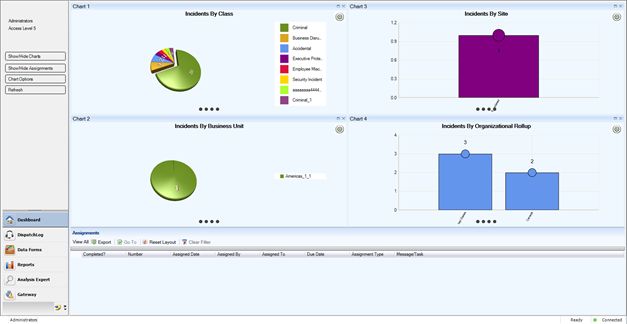
1. Charts: Get a quick overview of incident trends and statistics with the help of up to four selected bar or pie charts.
2. Assignments: Track activities or projects assigned to you, as well as those you have assigned to others, from start to finish.
· Resize the individual elements by dragging the borders surrounding them.
· To display/hide one of the Dashboard elements, click Show/Hide Charts, or Show/Hide Assignments on the Navigation pane.
· To refresh the view of the Dashboard, click the Refresh button on the Navigation pane.