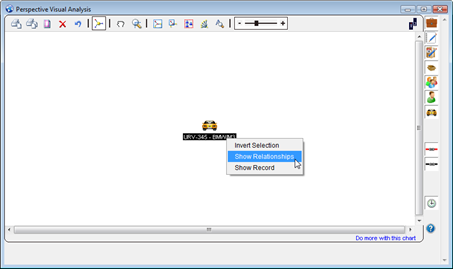
1. Right-click the icon in the center of the Visual Analysis window, and select Show Relationships.
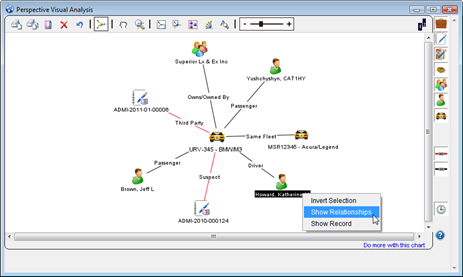
2. A link chart of related records will appear in the window, with the original record at the center. Right-click any icon in the link chart, and then select one of the following options:
·Invert Selection: Selects all records except the current one.
·Show Relationships: Displays all Incident, Case, Item, Person, Organization, or Vehicle records linked to the selected record.
·Show Record: Opens the selected record in Perspective. (The Visual Analysis window may still be open in the foreground. In this case, minimize the Visual Analysis window to view the record in Perspective.)
3. Click on the top toolbar options to customize the appearance of your chart for clear visual analysis, or to find, select, or remove a particular record from your chart:
Print on Single Page
Prints all details of your chart on a single page.
Print at 100% Scale
Prints your chart at 100% scale, which would usually occupy more than one page.
Page Setup
Enables you to adjust margins and page setup settings before printing.
Delete Selection
Removes the highlighted record(s) from the chart.
Undo Delete
Brings back the record(s) that were just deleted.
Key Entity Emphasis
Enlarges the central records in your link chart placing focus back on them. Click again to restore the central records to regular size.
Panning Tool
Enables dragging of the entire link chart allowing you to quickly view different areas of the chart.
Zoom to Area
Click the Zoom to Area button, and then click and drag on the chart to select an area with the help of the mobile zoom box. The window will fill with an enlarged display of the selected area.
Fit to Window
Fits the entire link chart in the window, making it easier to see the overall shape and the number of connections in the chart.
Fit Selection to Window
Click and drag on the chart to select an area of interest with the help of a box. Alternatively, select multiple records holding down the Ctrl key while clicking the record icons. Then, click the Fit Selection to Window button. The window will fill with all records that are currently selected in the link chart.
Select All
Selects all the records in the link chart.
Reorganize
Changes the arrangement of the record icons restoring the link chart to its original layout.
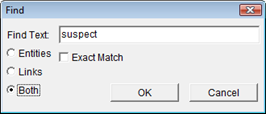
Find
Searches for a chart entity and/or link that contains a particular string of text. The Find function only searches the text displayed in the window; it does not search actual records. Once you click the Find button, the Find dialog will open.
a. Type the search text in the Find Text field.
b. Choose to search Entities (e.g., incident numbers, person names, license plate numbers), Links (e.g., suspects, associates, subjects of interest), or Both.
c. Select Exact Match to only search for text that matches the search string precisely.
d. To execute your search, click OK. The window will select and zoom in on any entities and/or links matching your search criteria.
Zoom
Click and drag the slider back and forth to zoom the window in and out.
4. Click the buttons on the right toolbar to hide particular entities from your link chart. By default, these entities are displayed in your link chart. Click again to restore the original link chart layout and/or to re-display the entities.
Case
Hides cases from your link chart.
Incident
Hides incidents from your link chart.
Activity
Hides activities from your link chart.
Item
Hides items from your link chart.
Organization
Hides organizations from your link chart.
Person
Hides persons from your link chart.
Vehicle
Hides vehicles from your link chart.
Involvements
Hides involvements from your link chart. Involvements, represented by red connecting lines, show that an item, organization, person, or vehicle was involved in a particular incident (e.g., Suspect, Responding Service, Indirectly Involved).
Associations
Hides associations from your link chart. Associations, represented by black connecting lines, show that particular incidents, cases, items, organizations, persons, or vehicles are associated with each other by relationship or ownership (e.g., Alias, Contracted To/By, Similar M.O.).
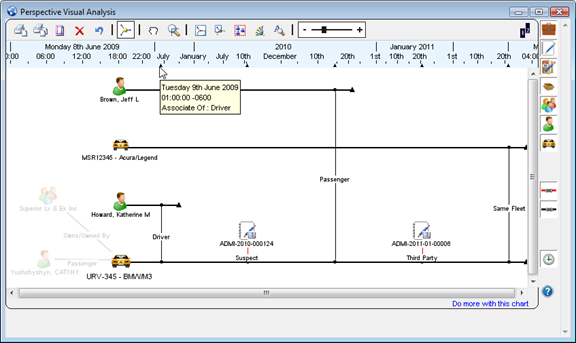
Timeline
Transfers your link chart into the timeline mode (see the image below). All entities and links will be reorganized sequentially, allowing for time series analysis.