1. To begin charting your query results, click  Chart. If your query results contain child data, you may choose to chart either parent records (e.g., Person Detail) or child records (e.g., Person Incidents Involvement) by selecting the appropriate data label under the attached lookup.
2. A charting window will open with a blank Viewing pane, a list of variables available for charting listed in the Data pane on the left, and a grid with raw chart data listed at the bottom Data tab. (In this section, we will be looking at the case of an organization that wants to know the proportions of marital statuses of their employees by gender.)
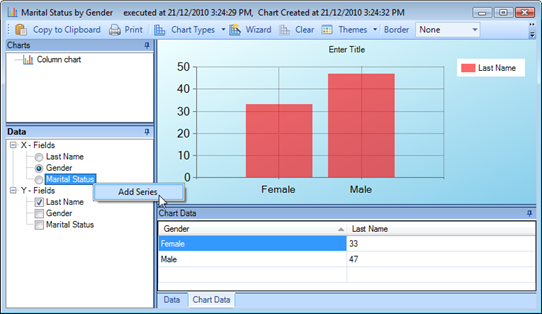
3. In the Data pane, select an X-Field (e.g., Gender) and a Y-Field or multiple Y-Fields (e.g., Last Name) for your chart from the available options. The X-Field data will appear on the horizontal x-axis of your chart. The Y-Field data will appear on the vertical y-axis of your chart. If you select more than one Y-Field, ensure that they have the same unit of value (e.g., dollars, items). Note that Y-Fields are always charted as numerical values. Generally, text fields are counted (e.g., quantity of Incident Numbers or Last Names), while numerical fields are summed (e.g., amounts of Incident Losses).
4. Your chart will appear in the Viewing pane. By default, your initial chart will be formatted as a column chart. The bottom pane will display your selected Chart Data.
5. You may copy and paste data from the Data or Chart Data tabs into Excel by highlighting the data and then using the Ctrl+C and Ctrl+V keyboard commands.
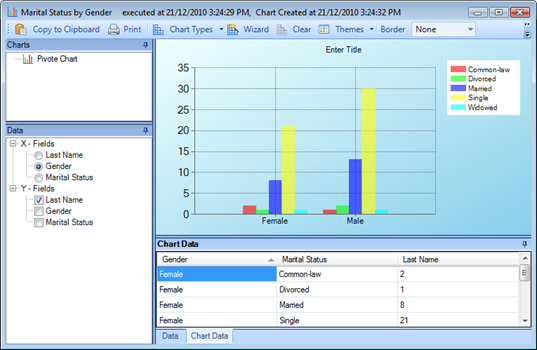
6. If you want to select an additional variable for your chart (e.g., Marital Status) to see the distribution of one of your variables by another (e.g., Marital Status by Gender), right-click the variable under X-Fields, and select Add Series. The chart type will switch to a pivot chart. The new variable will be added to the x-axis and will be explained in the chart’s legend.
Note: Once a Series variable is incorporated into your chart, only one Y-Field will be charted. Additional Y-Fields will automatically be dropped from your chart.
7. If the chart does not have a series field, you may use the available toolbar options to adjust its appearance. These options are also available with a greater range of functionality in the Chart Wizard. For description of the various chart customization options in Chart Wizard, see Appendix D: Chart Wizard.
a. To change the default column chart to a different chart type, choose an option from the  Chart Types lookup list (e.g., pie, bar, area). The Charts pane will automatically populate with the name of the selected chart.
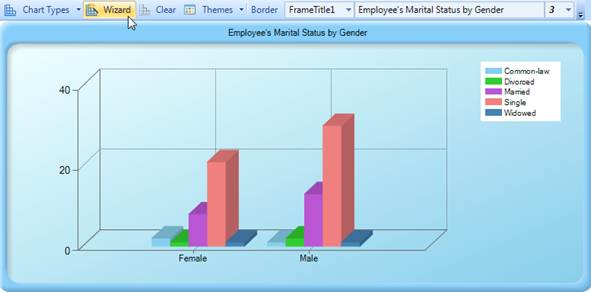
b. To change the default 2D (two-dimensional) chart to a 3D (three-dimensional) chart, choose 3D in the drop-down menu on the toolbar. Click and drag the chart to rotate it and adjust its perspective.
c. Enter a name for the chart in the Title text box.
d. From the Border lookup list, select a border or frame style for the chart.
e. In the  Themes lookup list, select a color theme for your chart.
If the chart does include a series field, any customizing of the chart, including changing the chart type, must be done in the Chart Wizard.
8. To copy your chart to clipboard  or print it
  , click the appropriate icon on the toolbar.
9. If you want to erase this chart and construct a new chart of the query results, click  Clear on the toolbar, or right-click in the chart area and select Clear.