|
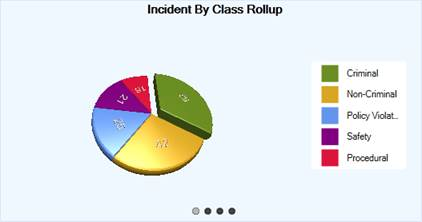
Incident by Class
|
Displays the number of incidents by the specified number of incident classes (e.g., Criminal, Procedural, Policy Violation) that have taken place during the specified period of time.
|
|
Incident by Business Unit
|
Displays the number of incidents by the specified number of business units (e.g., North America, Europe, Asia) that have taken place during the specified period of time.
|
|
Incident by Site
|
Displays the number of incidents by the specified number of sites (e.g., Alberta, Ontario, British Columbia) that have taken place during the specified period of time.
|
|
Incident by Organization
|
Displays the number of incidents by the specified number of organizations (e.g., Edmonton, Leduc, Sherwood Park) that have taken place during the specified period of time.
|
|
|
|
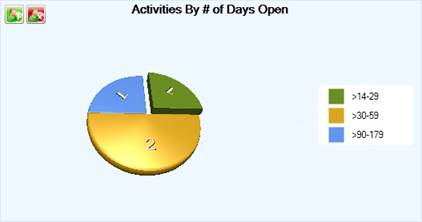
Activities by Number of Days Open
|
Displays the number of activities with an Open status arranged by the set periods of time for which the Activity records have been open (e.g., >14-29 days, >30-59 days).
|
|
Cases by Number of Days Open
|
Displays the number of cases without a Closed Date/Time arranged by the set periods of time for which the Case records have been open.
|
|
Incidents by Number of Days Open
|
Displays the number of incidents with an Open status arranged by the set periods of time for which the Incident records have been open.
|
|
Investigations by Number of Days Open
|
Displays the number of investigations without a Closed Date/Time arranged by the set periods of time for which the investigations have been open.
|
|
When one of these charts is displayed on the Dashboard, you may choose to view the Activity/Case/Incident/Investigation data filtered for a specific user. To filter the Activity data for a Record Owner, the Case, the Incident data for a Case Investigator/Case Manager/Case Supervisor, or the Investigation data for an Investigator, click on the plus icon  in the chart section and select the required user from the entity list. To reset the filter and show the data that applies to all users in the system, click the x icon in the chart section and select the required user from the entity list. To reset the filter and show the data that applies to all users in the system, click the x icon  . .
|
|
|
|
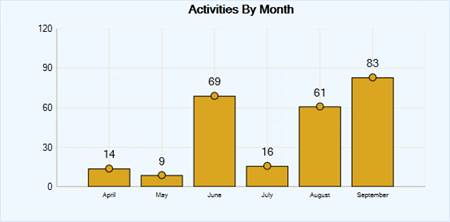
Activities by Month
|
Displays the number of the specified portion of activities that have been recorded in each of the twelve months of the selected year. If no data has been recorded for a specific month, it will be absent from the chart.
|
|
Incidents by Month
|
Displays the number of the specified portion of incidents that have been recorded in each of the twelve months of the selected year. If no data has been recorded for a specific month, it will be absent from the chart.
|
|
Investigations by Month
|
Displays the number of the specified portion of investigations that have been recorded in each of the twelve months of the selected year. If no data has been recorded for a specific month, it will be absent from the chart.
|
|
Cases by Month
|
Displays the number of the specified portion of cases that have been recorded in each of the twelve months of the selected year. If no data has been recorded for a specific month, it will be absent from the chart.
|
|
|
|
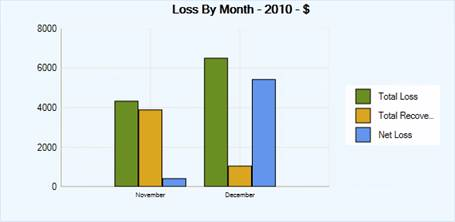
Loss by Month
|
Shows the monetary losses (Total Loss, Total Recovered, and Net Loss), in dollars, resulting from the selected portion of incident activity in each of the past twelve months of the specified year. This chart is only available in the bar chart form.
|
|
|
|
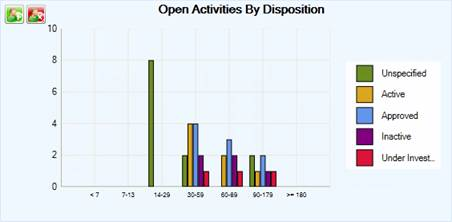
Open Activities by Disposition
|
This preset chart does not have any further chart settings and is only available in the bar chart form. It displays the number of activities with an Open status colour-coded for specific Disposition (e.g., Under Investigation) and arranged by the set periods of time for which the Activity records have been open (e.g., >14-29 days, >30-59 days).
|
|
Open Incidents by Disposition
|
This preset chart does not have any further chart settings and is only available in the bar chart form. It displays the number of incidents with an Open status colour-coded for specific Disposition (e.g., Unsolved) and arranged by the set periods of time for which the Incident records have been open.
|
|
Open Cases by Disposition
|
This preset chart does not have any further chart settings and is only available in the bar chart form. It displays the number of cases without a Closed Date/Time colour-coded for specific Disposition (e.g., Active) and arranged by the set periods of time for which the Case records have been open.
|
When one of these charts is displayed on the Dashboard, you may choose to view the Activity/Case/Incident data filtered for a specific user. To filter the Activity data for a Record Owner, or the Case or Incident data for a Case Investigator/Case Manager/Case Supervisor, click on the plus icon  in the chart section and select the required user from the entity list. To reset the filter and show the data that applies to all users in the system, click the x icon in the chart section and select the required user from the entity list. To reset the filter and show the data that applies to all users in the system, click the x icon  . .
|
|
|
|
Open Assignments by Due Date
|
Displays the number of assignments that have not been checked off as Completed arranged by their closeness to the Due Date (e.g., Overdue, Tomorrow, Others).
|
|
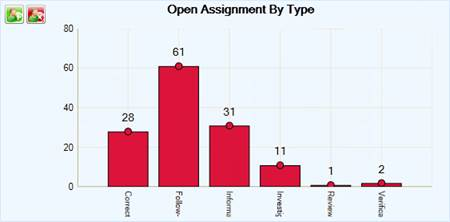
Open Assignments by Type
|
Displays the number of assignments that have not been checked off as Completed arranged by specific assignment Type (e.g., Correction Notice, Information Request).
|
|
When one of these charts is displayed on the Dashboard, you may choose to view the Incident, Case, and Activity assignment data that have been filtered for a specific recipient of assignments. To filter the data for a specific Assigned To user, click on the plus icon in the chart section and select the required user from the entity list. To reset the filter and show the data that applies to all users in the system, click the x icon .
|
|
|
|
Perspective Gauge
|
Resembles an automobile speedometer gauge, displaying the proportion of the number of incidents that has been recorded for the current year to the number of incidents that had been recorded in the year of your selection effectively comparing the two values. You can change the compared to year using the chart’s attached lookup.
The Total Year diagram compares the number of incidents for the total calendar years (e.g., the periods of January 1 to December 31).
The Year to Date diagram compares the number of incidents for the years to the current date (e.g., if today’s date is October 1, then it will compare the periods of January 1 to October 1 only).
The This Month diagram compares the number of incidents for the current month (e.g., if today is October, then it will compare the months of October only).
|